


India’s Unified Payments Interface (UPI) has transformed from a niche experiment into the lifeblood of daily transactions, powering everything from street-side chai stalls to grocery chains. But beneath the dazzling surge in usage lurk structural challenges — fiscal strain on banks, over-reliance on a handful of apps, and gaps in data transparency. As the average daily transaction value nears ₹90,000 crore, experts warn that UPI’s triumph may be sowing the seeds of future vulnerability.
UPI Adoption Surges, Redefining Payments
New research from the State Bank of India (SBI) shows that average daily UPI transaction values climbed to ₹90,446 crore ($10.9 billion) in August 2025, up from ₹75,743 crore ($9.1 billion) in January. Both value and volume growth signal a structural shift in India’s payment habits. Originally designed by the National Payments Corporation of India (NPCI) for small peer-to-peer transfers, UPI has become the dominant retail payment platform, reshaping consumer behaviour, merchant operations, and the role of cash.
By May 2025, UPI accounted for 91% of total retail money demand (UPI plus debit card ATM withdrawals), compared with just 40% in late 2019. Monthly UPI transactions between April and July averaged ₹24.6 trillion ($296 billion), far outpacing the ₹193 billion rise in cash circulation over the same period. SBI economists note that each additional rupee on UPI reduces debit card spending by 14 paise, highlighting the cannibalisation of traditional payment methods.
The Geography of Digital Dominance
For the first time, NPCI released state-wise UPI data, revealing growth hotspots and persistent digital divides. Maharashtra led with 1.9 billion transactions in July — 9.8% of national volume — and ₹2.3 trillion ($27.5 billion) in value. Karnataka followed with 5.5% of volume and 5.8% of value, reflecting Bengaluru’s fintech adoption. Uttar Pradesh emerged third, the only northern state in the top five, illustrating UPI’s spread beyond urban centres. Telangana and Tamil Nadu rounded out the top five.
Interestingly, “unclassified” transactions — those with no state attribution — formed the largest segment: 43% by volume and 39% by value, underscoring limits in current data granularity.
Banks and Apps: Uneven Winners
The benefits of UPI are unevenly distributed. SBI processed 5.2 billion remitter transactions, over three times HDFC Bank, while Yes Bank led in receipts with nearly 8 billion beneficiary transactions. Public banks dominate outflows; private banks dominate inflows.
Among third-party apps, PhonePe leads, followed by Google Pay and Paytm. SBI Research warns that over-concentration in a few apps “may stifle India-centric fintech innovation” and recommends a homegrown AI-driven alternative to safeguard data sovereignty.
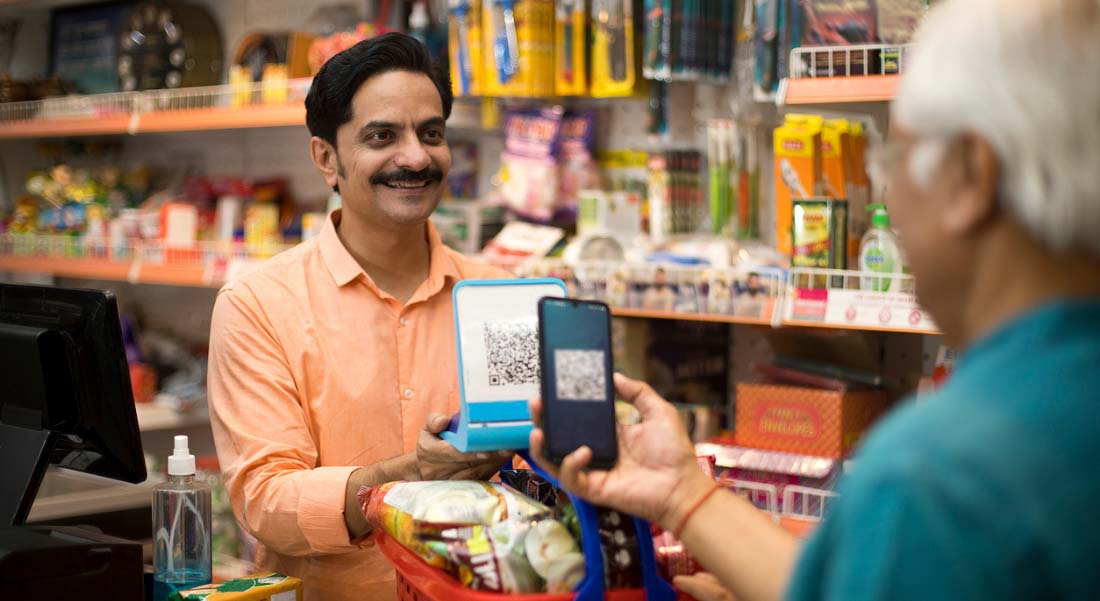
Merchants and Consumers: The Low-Ticket Revolution
Person-to-merchant (P2M) payments now account for 64% of UPI transactions by volume (up from 39% in 2020) and 29% by value (up from 13%). Grocery purchases dominate, followed by restaurants, pharmacies, and utilities. Average ticket sizes remain low, showing that mobile payments now penetrate even the smallest everyday transactions.
Debt repayments to NBFCs and fintech lenders, though just 1.3% of volumes, accounted for the highest transaction value — ₹93,857 crore ($11.3 billion) in July — reflecting the embedding of credit and repayment cycles within UPI.
Policy Push and Fiscal Strain
Government mandates, including zero merchant discount rates (MDR) for RuPay and BHIM-UPI transactions, removed cost barriers for merchants. Small-ticket transactions up to ₹2,000 carry a 0.15% reimbursement to acquiring banks.
But fiscal support is falling short: the FY26 budget allocated ₹437 crore ($53 million) for incentives, while SBI estimates the real cost at ₹4,000–₹5,000 crore ($480–$600 million). Without bridging this gap, banks and providers may face unsustainable losses, threatening the zero-MDR model.
The Road Ahead: Balancing Growth and Risk
UPI has driven inclusion, behavioural change, and digital penetration, but concentration risks, fiscal pressure, and limited merchant-level transparency remain. SBI Research urges NPCI to expand merchant category code (MCC) disclosures from 29 to at least 100, enhancing risk management and transparency.
As India moves toward its trillion-dollar digital economy goal, UPI’s next phase will require focus on competition, diversity, and resilience. Otherwise, the very success that transformed payments could become the source of systemic vulnerability.


